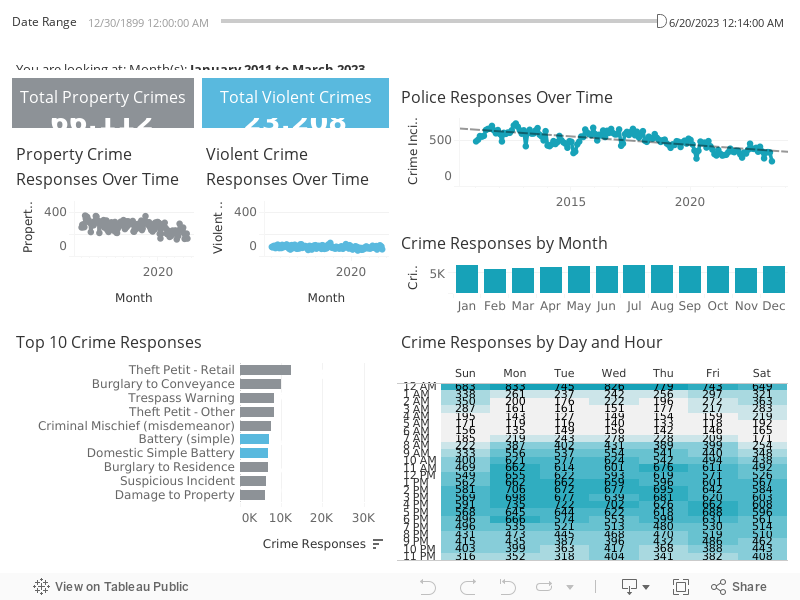
Description: This dashboard shows crime incidents dating back to January 2011. It shows crime incidents that are under the jurisdiction of Gainesville Police Department. It shows crime incidents by type, by month, and time of day. The incident locations on the map are not exact due to "Marsy's Law".
How to use: The dashboard and map are interactive. Use the slider on top to filter by date range. You can also filter crime incidents by Month Over Time, by Type, or Hour of Day by clicking on the bar graphs or line graph. To select multiple, use Ctrl + click on Windows or Cmd + click on Mac. Click again to unselect. Hovering over the graphs will give you more information about the data. Scroll to the bottom of the page to find a link to the raw data available on dataGNV, the City of Gainesville's Open Data Portal.